Tools
Identification of upstream regulatory factors of genes based on machine learning methods
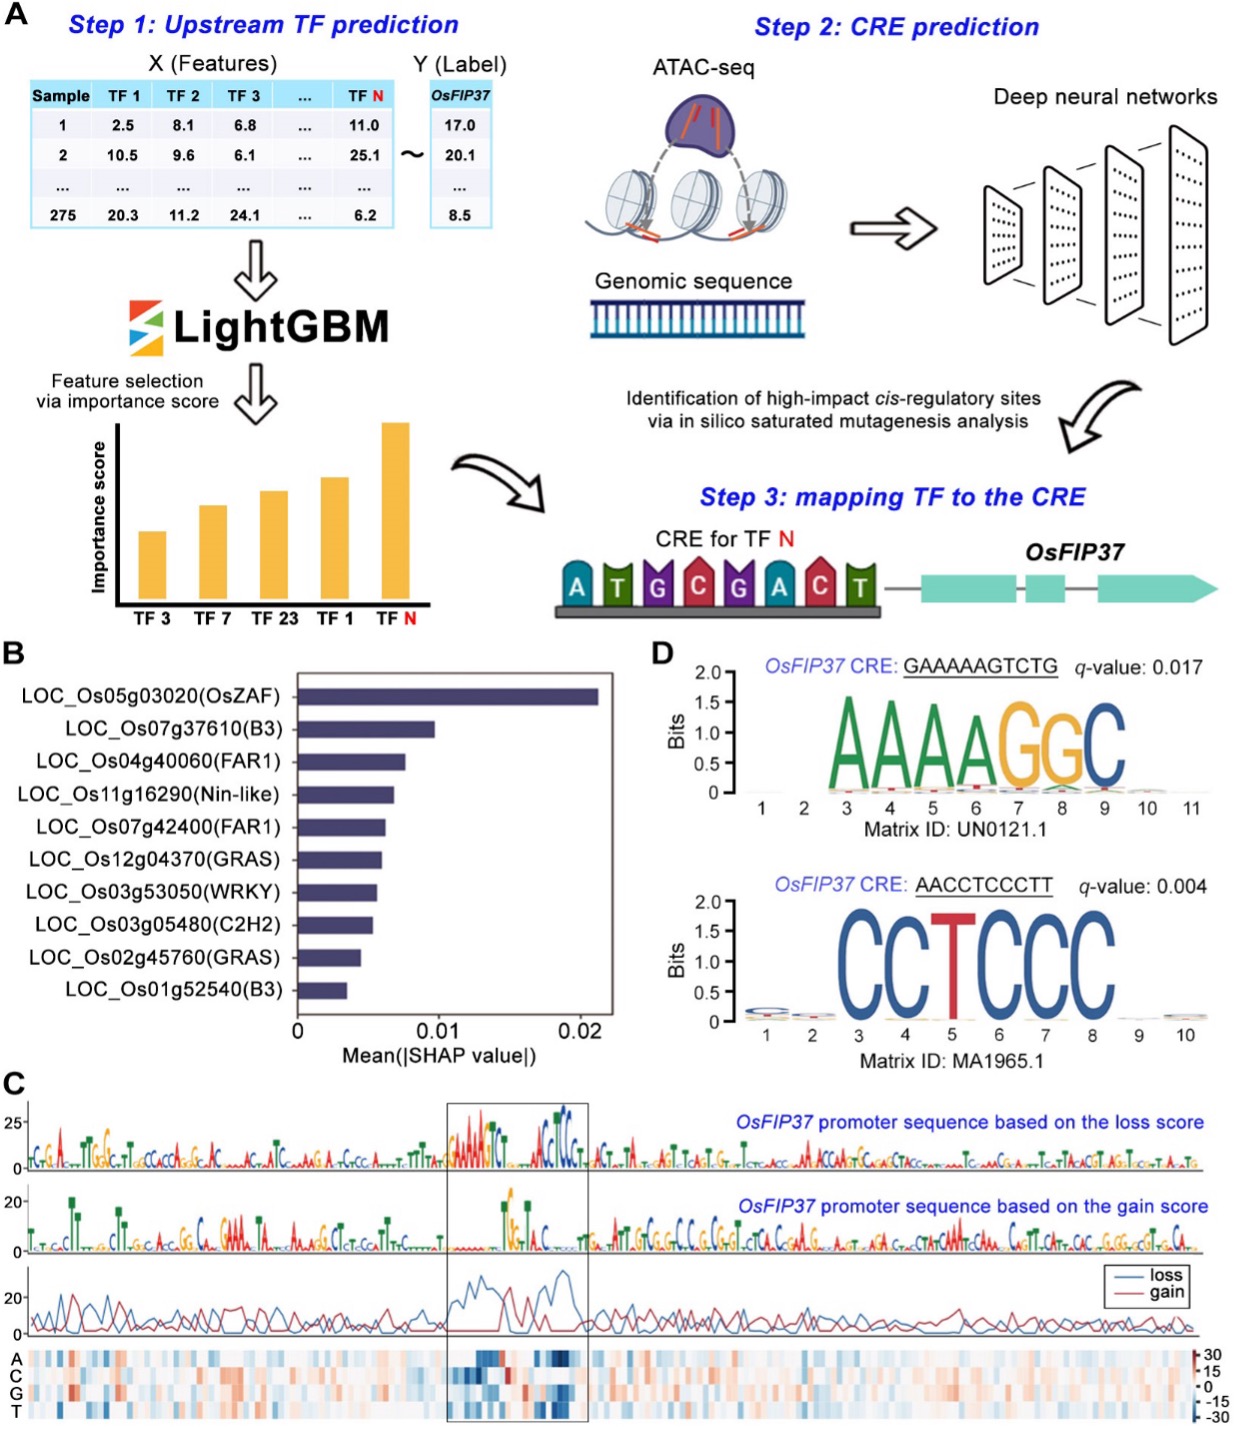
Model for predicting upstream regulatory genes and cis-regulatory elements of the gene. Step 1: a training model was built using LightGBM with a feature matrix (X) consisting of expression levels of transcription factors (TFs) to predict the expression level of the gene (Y) in the plot. TFs were ranked based on their importance in the model, with higher importance scores indicating a higher likelihood of regulating the gene. The TF (e.g. N) with the highest importance score in the LightGBM model was selected for further investigation. Step 2: a deep learning model was constructed using the chromatin accessibility data determined by transposase-accessible chromatin with sequencing (ATAC-Seq) assay and the reference genome sequence to predict CREs within the promoter region of the gene. Step 3: a regulatory paradigm was established between an upstream TF (e.g. N) and the CRE of the gene.
Source code: https://github.com/zhaouu/TF_gene_regulation_predict
Citation: Cheng P, Zhao H, Zhang S, et al. Feedback regulation of m6A modification creates local auxin maxima essential for rice microsporogenesis[J]. Developmental Cell, 2025.
2025-01-24
Prioritizing candidate genes by integrating knowledge-based gene sets, variant effects, GWAS, and TWAS data
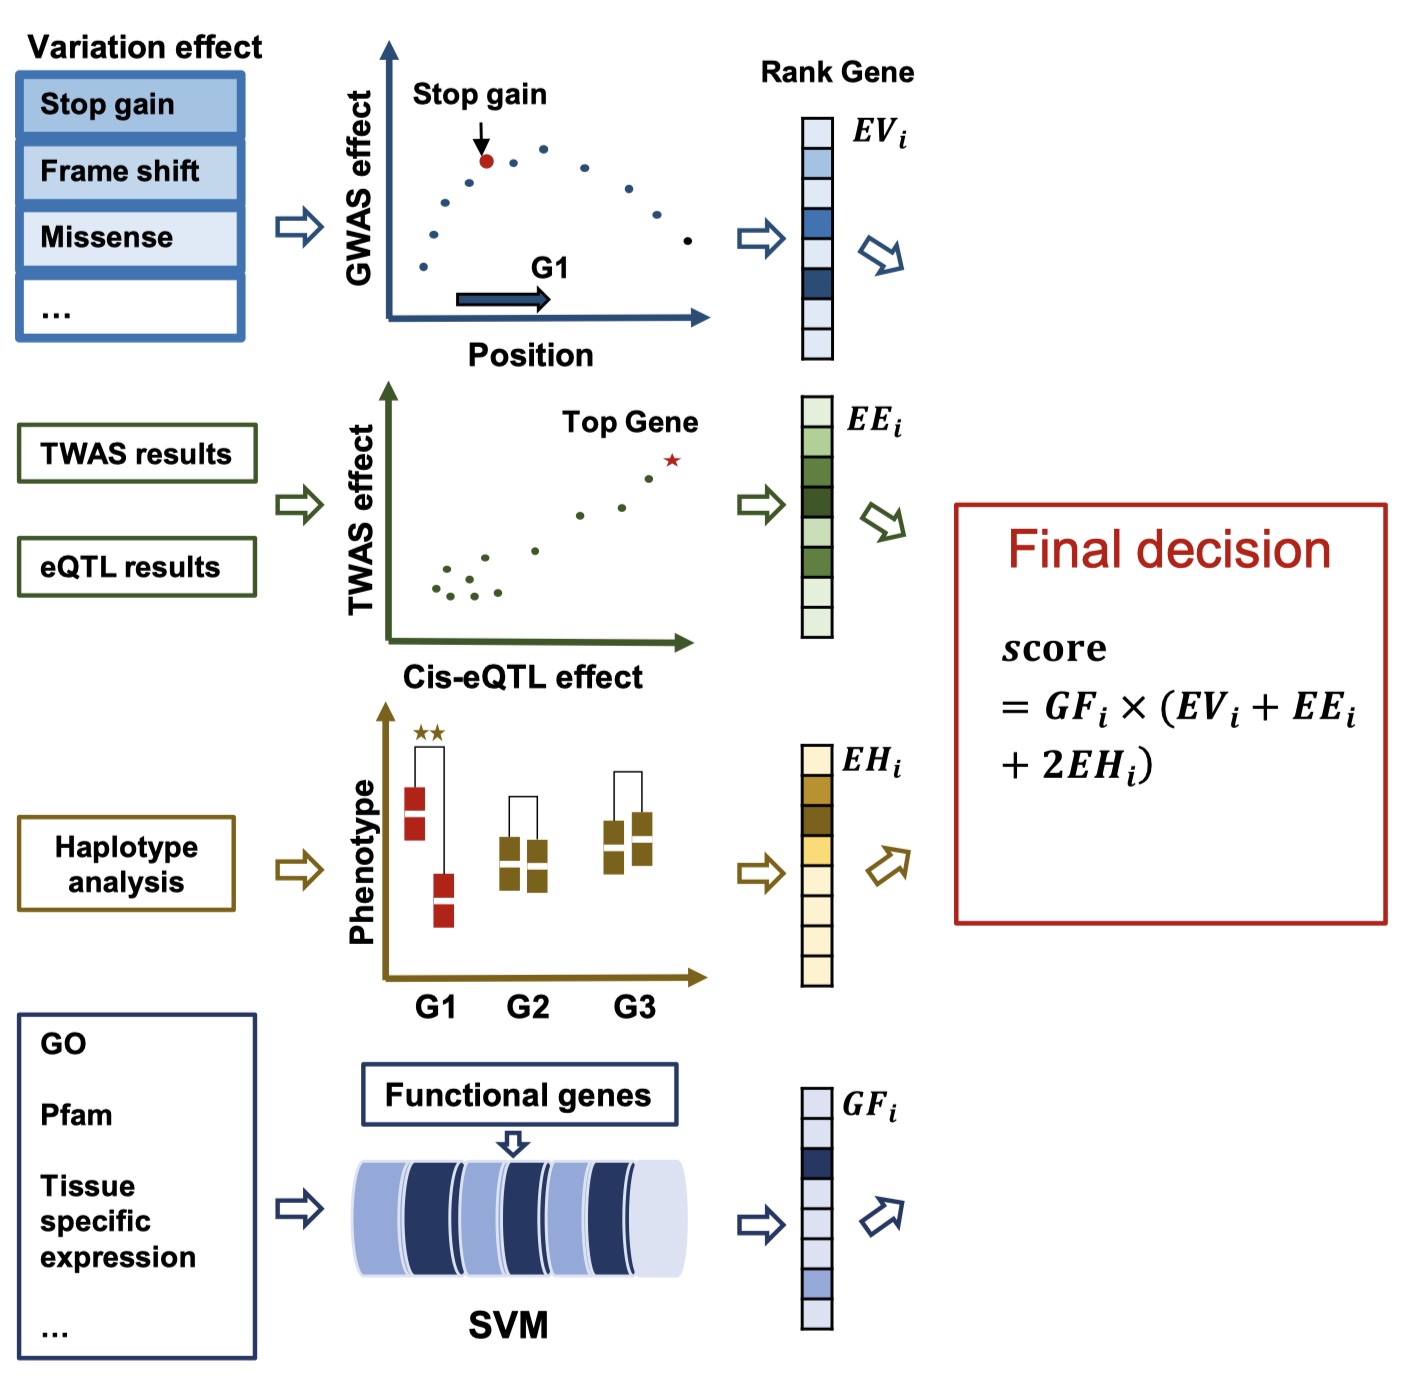
To prioritize candidate genes within GWAS QTL regions, we employed multi-omics datasets to establish a comprehensive scoring framework. First, we evaluated the effects of genetic variations within gene regions using SNP effector annotations (Cingolani et al., 2012) and the GWAS P-values of the variations, normalized through a Min-Max scaling approach. Second, the gene expression effects within candidate regions were assessed based on TWAS P-values and cis-eQTL results. Third, genes were categorized into distinct haplotypes based on variations in their gene and upstream regions, and a haplotype-based association score was calculated. Fourth, we predicted the probability of a gene being related to the phenotype by utilizing 8,283 features derived from four datasets: (i) Gene Ontology (GO) categories, (ii) InterPro protein classifications, (iii) gene expression datasets from Lu et al. (2018), and (iv) differentially expressed genes (DEGs) from known SOC-related mutants or overexpression lines. Additionally, we incorporated independent component analysis (ICA) components identified from population transcriptomes at 20 and 40 days after flowering (DAF). Using these features, we applied a support vector machine (SVM) to predict gene functions. Finally, we integrated the scores from these four steps to determine the genes most likely to influence the phenotype.
Source Code: https://github.com/zhaouu/POCKET
Python package: https://pypi.org/project/Gene-POCKET/
Citation: Tang, S., Zhao, H., Lu, S., Yu, L., Zhang, G., Zhang, Y., . . . Guo, L. Genome- and transcriptome-wide association studies provide insights into the genetic basis of natural variation of seed oil content in Brassica napus. Molecular Plant. doi:10.1016/j.molp.2020.12.003
2025-01-23